Local wire-level observability

See what Claude Code actually sends over the wire.

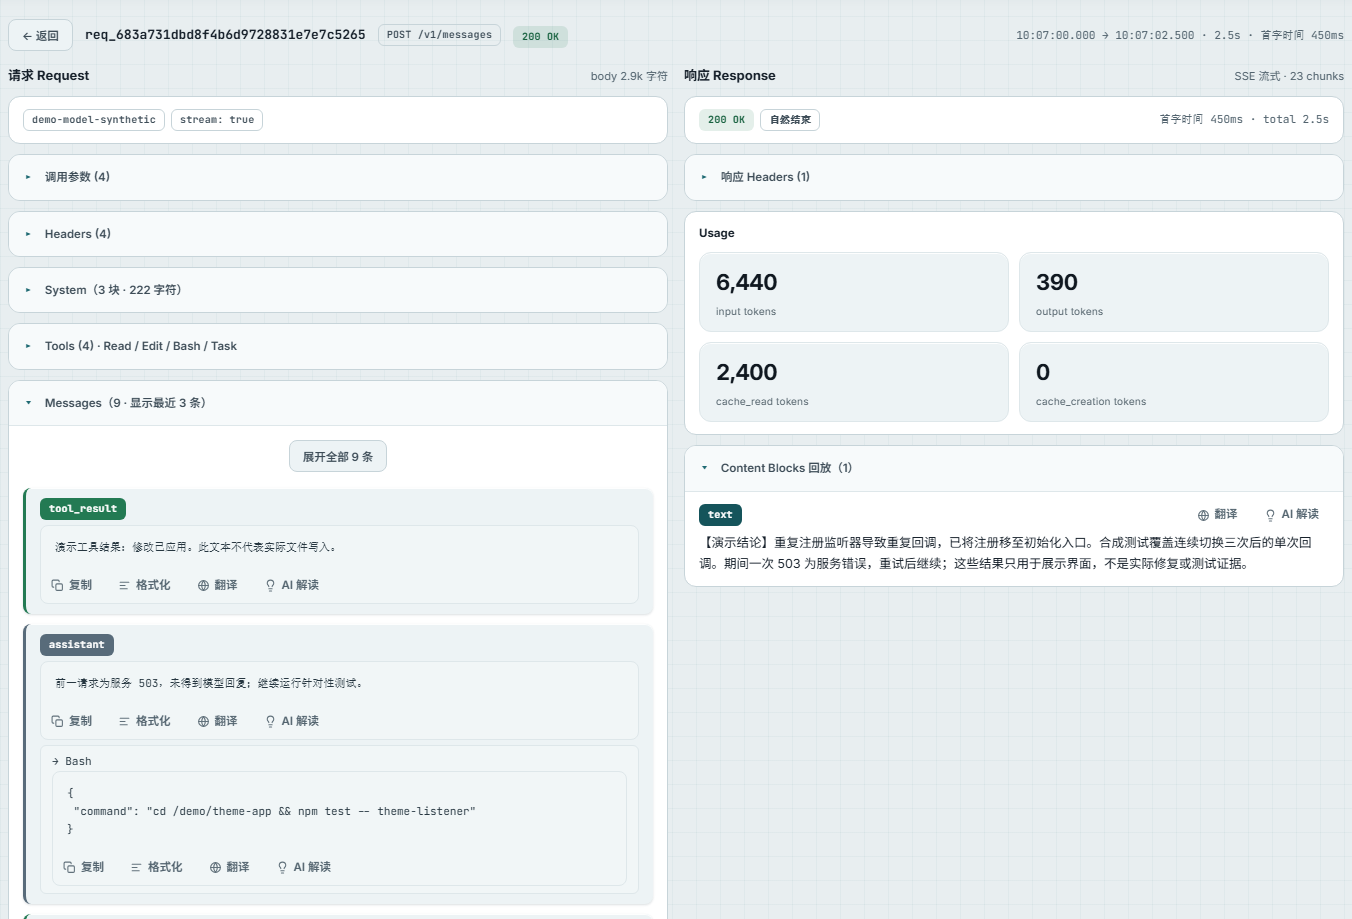
Claude Code shows its view of a session. CC Wire Analyzer records the full HTTP request and response before that view is post-processed: system prompts, tool schemas, hidden calls, SSE timing, upstream errors and exact token usage.

  • Windows + macOS
  • No Python required
  • No telemetry
  • MIT code
live request · wire view
POST /v1/messages req_7f3a · 4.5s
  • systemprompt blocks · watermark intact
  • tools[77]names · descriptions · JSON schemas
  • messages[24]main turn · subagent · tool results
  • usage45k input · 800 output · 44k cache
SSE message_start → content_block_delta → message_delta → message_stop
headers redacted · body recorded verbatim
CC Wire Analyzer capture list showing Claude Code requests, models, latency, token counts and failed calls
A real capture list — requests, hidden classifiers, latency, failures and tokens in one place. dark professional theme · recordings remain local

The missing layer

Everything that crosses the boundary, not a reconstruction after the fact.

The wire is where Claude Code's real conversation with the model exists. Record it once, inspect it in the GUI, or let another agent query the same data over HTTP.

system[]

Prompts as transmitted

See the complete system prompt, injected reminders, title generation, compaction and security-review prompts.

tools[77]

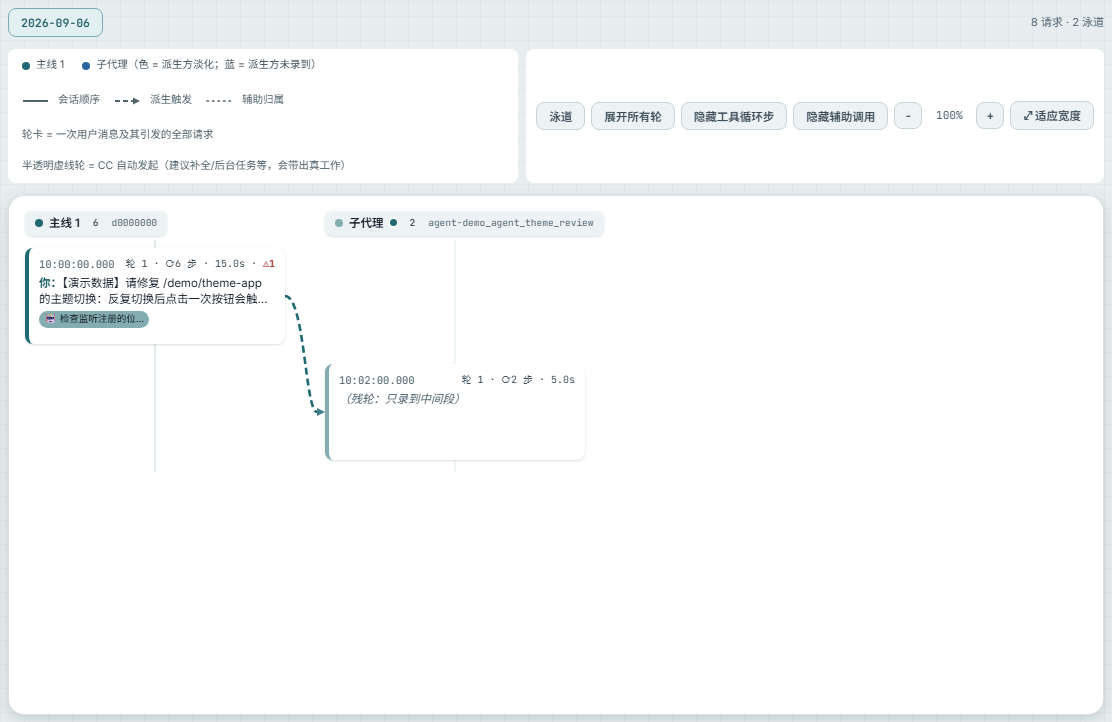
Tools and subagents

Inspect every tool schema, the prompt that spawned a subagent and the request chain that followed.

event: delta

SSE and upstream errors

Follow the streaming timeline and read failures that never surface in Claude Code's own session view.

GET /api/*

Agent-readable evidence

The GUI and the open local HTTP API share one source, so an agent can search and diagnose a recording itself.

A failure CC did not show

Session titles quietly stopped generating.

The UI showed no error. The failed auxiliary requests were still present on the wire, already carrying the upstream's diagnosis.

one recording → one agent query → root cause found
wire diagnosis
GET /api/diagnose/errors

output_config.effort 'max' is not supported
when thinking is disabled on this model.

settings.json      effortLevel: low
environment        CLAUDE_CODE_EFFORT_LEVEL: max

root cause: environment wins → contradictory request

Three complementary views

Wire, JSONL and OTLP answer different questions.

CC Wire Analyzer does not replace Claude Code logs or telemetry. It fills the one layer neither of them can represent: the raw exchange with the upstream endpoint.

WIRE
Raw HTTP

Exact transmitted prompts, headers, bodies, SSE chunks, upstream errors and reported usage.

JSONL
Claude Code's view

Conversation structure, local metadata and the session after Claude Code has processed it.

OTLP
Metrics

Aggregated latency, cost, token and operational telemetry across sessions.

Local by design

A traffic inspector should be explicit about what it touches.

Requests still go to the upstream Claude Code was already using. The app records locally, redacts credential headers and changes one setting to route traffic through itself.

Recordings stay on your machine

Plain JSONL under ~/.cc-wire-analyzer/. No account, cloud storage or telemetry.

One routing field

Only ANTHROPIC_BASE_URL is patched; it is backed up and restored on stop or exit.

Credentials are redacted

Authorization headers are not stored. Message bodies remain verbatim because that evidence is the product.

No silent network activity

Optional AI analysis and update checks only run when you click them, against endpoints made visible to you.

Open source · local · inspectable

Record one session. Ask the wire what happened.

Download the Windows executable or macOS app, start the local proxy, then use Claude Code normally. No Python is required for release builds.